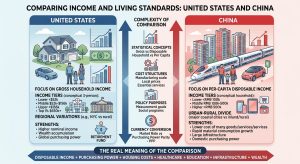
Comparing income levels in the United States and China is far more complicated than converting yuan into dollars. The two countries use different statistical concepts, have radically different cost structures, and measure income for different policy purposes. A meaningful comparison therefore requires looking beyond nominal income to disposable income, purchasing power, household size, wealth, and the cost of essential goods and services.
The U.S. Income Structure
In the United States, income comparisons commonly use gross annual household income. Pew Research Center, for example, defines middle-income households as those earning between roughly 67% and 200% of the national median household income, adjusted for household size and local cost of living.
Using a three-person household as a conceptual baseline, the broad distribution can be described as:
| Income Tier | Approximate Annual Household Income | General Characteristics |
| Lower Income | Below ~$52,000 | Greater exposure to housing, healthcare, and food-cost pressures; greater reliance on public assistance |
| Middle Income | ~52,000–156,000 | Broadly stable consumption, homeownership aspirations, retirement savings, and discretionary spending |
| Upper Income | Above ~$156,000 | Greater capacity to accumulate financial and real-estate assets |
| Top 1% | Roughly $650,000+ | Highly concentrated financial and business wealth |
These thresholds should not be treated as universal. A household earning $100,000 in a lower-cost region can have a substantially different standard of living from one earning the same amount in San Francisco, New York, or other high-cost metropolitan areas.
China’s Income Structure
China’s statistics operate differently. The National Bureau of Statistics places considerable emphasis on per-capita disposable income, while also distinguishing between urban and rural residents and dividing households into income quintiles.
This distinction is crucial. If a three-person Chinese household has RMB 150,000 in disposable income, its reported per-capita disposable income is RMB 50,000. The figure therefore cannot be directly compared with a U.S. household’s gross income.
Broadly, China’s income structure can be understood as:
| Income Tier | Approximate Household/Per-Capita Framework | General Characteristics |
| Lower Income | Below roughly RMB 100,000 ($ 15K) household income | Greater concentration among rural residents and lower-wage workers; consumption focused on necessities |
| Middle Income | Roughly RMB 100,000–500,000 ($15 -75K)household income | Rising discretionary consumption, housing ownership, automobiles, travel, and education |
| Higher Income | Above roughly RMB 500,000 ($75K) household income | Greater concentration of financial, property, and business assets |
These figures should be viewed as illustrative ranges rather than official Chinese definitions of a universal “middle class.” China’s official statistics are more nuanced than a simple three-tier classification.
The Three Comparisons That Matter
The first is gross versus disposable income. U.S. household-income statistics generally emphasize gross income, while Chinese disposable-income statistics reflect income remaining after taxes and certain social contributions. Comparing the two without adjustment can exaggerate the apparent difference.
The second is household versus per-capita income. American household income combines the earnings of multiple household members. Chinese per-capita disposable income divides household resources across individuals. The statistical units must therefore be normalized before meaningful comparisons can be made.
The third is nominal income versus purchasing power. Currency conversion at market exchange rates tells us how much income is worth internationally, but it does not tell us what that income can actually buy domestically.
PPP Changes the Picture—but Does Not Eliminate the Gap
Purchasing-power parity is therefore essential. Many goods and services are substantially cheaper in China, particularly manufactured goods, public transportation, basic services and some forms of everyday consumption. China’s enormous manufacturing base also means that consumers can access many products at prices that would be difficult to reproduce in the United States.
But PPP should not be used to claim that a particular Chinese income is automatically equivalent to a much higher American income. Housing in major Chinese cities can be extremely expensive relative to local incomes, while education, healthcare and other costs vary substantially by location and household circumstances.
The Urban-Rural Divide
China also has a structural distinction that makes national averages particularly misleading: the urban-rural income gap.
Urban disposable income remains substantially higher than rural disposable income. China’s coastal megacities—Beijing, Shanghai, Shenzhen, Guangzhou and others—operate within economic environments that can look dramatically different from those of smaller inland cities and rural areas.
The United States has major regional income differences as well, but they are not incorporated into the national statistical system in exactly the same way.
Income Is Only Part of the Story
Ultimately, comparing American and Chinese living standards through income alone produces an incomplete picture.
The more meaningful comparison is:
Disposable Income + Purchasing Power + Housing Costs + Healthcare Costs + Education Costs + Transportation Costs + Household Wealth + Public Infrastructure
On nominal income, the United States remains dramatically wealthier. Americans generally possess much greater income and financial purchasing power.
But China has narrowed the gap in material consumption and everyday living standards far more rapidly than income statistics alone suggest. Its advantages in manufacturing scale, infrastructure, transportation, consumer electronics, electric vehicles and many other goods allow Chinese households to obtain substantial material value at relatively low prices.
The central lesson is therefore not that Chinese middle-class income is equivalent to American middle-class income. It is that income statistics alone cannot adequately measure the economic experience of either society.
America’s advantage is most visible in income, financial wealth, asset ownership and global purchasing power. China’s progress is most visible in manufacturing capacity, infrastructure, consumer affordability and the ability to translate relatively modest incomes into increasing quantities of material goods and services.
That distinction is essential when evaluating the changing balance between the two economies. The real question is not simply “Who earns more?” It is “What does each society’s income actually buy, what assets does it generate, and what quality of life does it produce?”